PRTG - Monitoring Intune (Graph API, Microsoft Endpoint Manager)
How you can use PRTG to monitor your intune devices, compliance state, device encryption and overall number of devices.


The current trend towards web-based software applications and services such as Microsoft 365 also reflects the need of employees and companies to be able to work more mobile or in the home office. With modern IT work devices that work location-independent, ensuring the compliance of these devices is particularly important.
One option is to use PRTG Monitoring for Endpoint Manager (Intune).
With the management of the work devices by Microsoft Endpoint Manager (Intune), there is also the possibility of having endpoint manager information in your existing PRTG monitoring.
To monitor the indicators, we use monitoring software from Paessler. PRTG monitors data traffic, availability and performance of devices and applications in IT infrastructures. This includes monitoring for classic network devices such as servers, routers, switches and firewalls, as well as virtual environments and also – as in this example – you can use the right scripts to monitor cloud components such as Microsoft Endpoint Manager.
In this example, we would like to measure the following Microsoft Endpoint Manager indicators with PRTG:
- Number of managed devices (Windows, MacOS, iOS, Android)
- Number of devices by operating system
- Number of devices that are not compliant
- Number of devices that are not encrypted
Prerequisites
A Service Principal (app registration) is required in Azure AD in order to be able to read out the desired indicators. This must have the appropriate read permissions in the Microsoft Graph API (DeviceManagementManagedDevices.Read.All).
https://learn.microsoft.com/en-us/azure/active-directory/develop/app-objects-and-service-principals
The Powershell module «MSAL.PS» is installed on the PRTG server or the PRTG probe. It is the Microsoft Authentication Library module, which is required so that the script can retrieve an access token.
Install-Module MSAL.PS -Scope AllUsers -ForcePowershell - Install MSAL Library (Microsoft Authentication Library)
The script uses this library at one point to get an access token:
# acquire azure authentication token
$MsalToken = Get-MsalToken -TenantId $tenant_id -ClientId $app_id -ClientSecret ($client_secret | ConvertTo-SecureString -AsPlainText -Force)

#Connect to Graph using access token
Connect-Graph -AccessToken $MsalToken.AccessToken
powershell - acquire azure authentication token
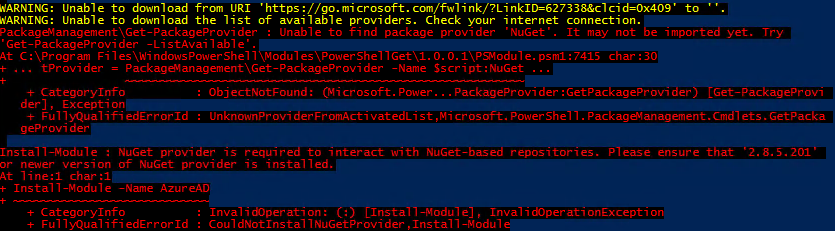
If the above error message appears, NuGet cannot be installed, TLS 1.2 must first be enforced.
[Net.ServicePointManager]::SecurityProtocol = [Net.SecurityProtocolType]::Tls12
Install-PackageProvider NuGet
powershell - enforce tls 1.2
service principal (app registraion)
Now a “Service Principal” (app registration) including Secret must be created in Azure Active Directory.
During this process you will receive various information, which you then need to run the monitoring script so that it can access the information in Azure:
- application id (app_id)
- azure tenant id (tenant_id)
- application client secret (client_secret)
The creation of the Service Principal is described in detail in the download (readme).
Powershell Graph API
The desired Endpoint Manager indicators are provided by Microsoft via the Graph API. In the past, each product had its own API or even multiple APIs. Exchange knows EWS, REST, ActiveSync and MAPI/HTTP, Skype for Business has a UCWA and a UCMA and so the story can be told endlessly. Each API has its own URL, methods and format, and authentication mechanisms.
With Microsoft Graph, Microsoft wants to provide uniform access to all data via a REST interface. Our script will use the following endpoint:
https://graph.microsoft.com/V1.0/deviceManagement/managedDevicesThis is documented in more detail here at Microsoft.
PRTG Script
Download the PowerShell script or the ZIP and unpack it in the PRTG Probe path C:/Program Files (x86)/PRTG Network Monitor/Custom Sensors/EXEXML.
Powershell scripts downloaded from the internet still need to be unblocked.
Unblock-File v2_prtg_intune_device_monitor.ps1PRTG Configuration
Create Device
- Create a device in PRTG, e.g. Microsoft 365 (IP address irrelevant, e.g. 127.0.0.1).
- Enter the Azure user name and password created above in the properties of the device under Credentials for Windows Systems for Username and Password. Username must be the user’s email address.
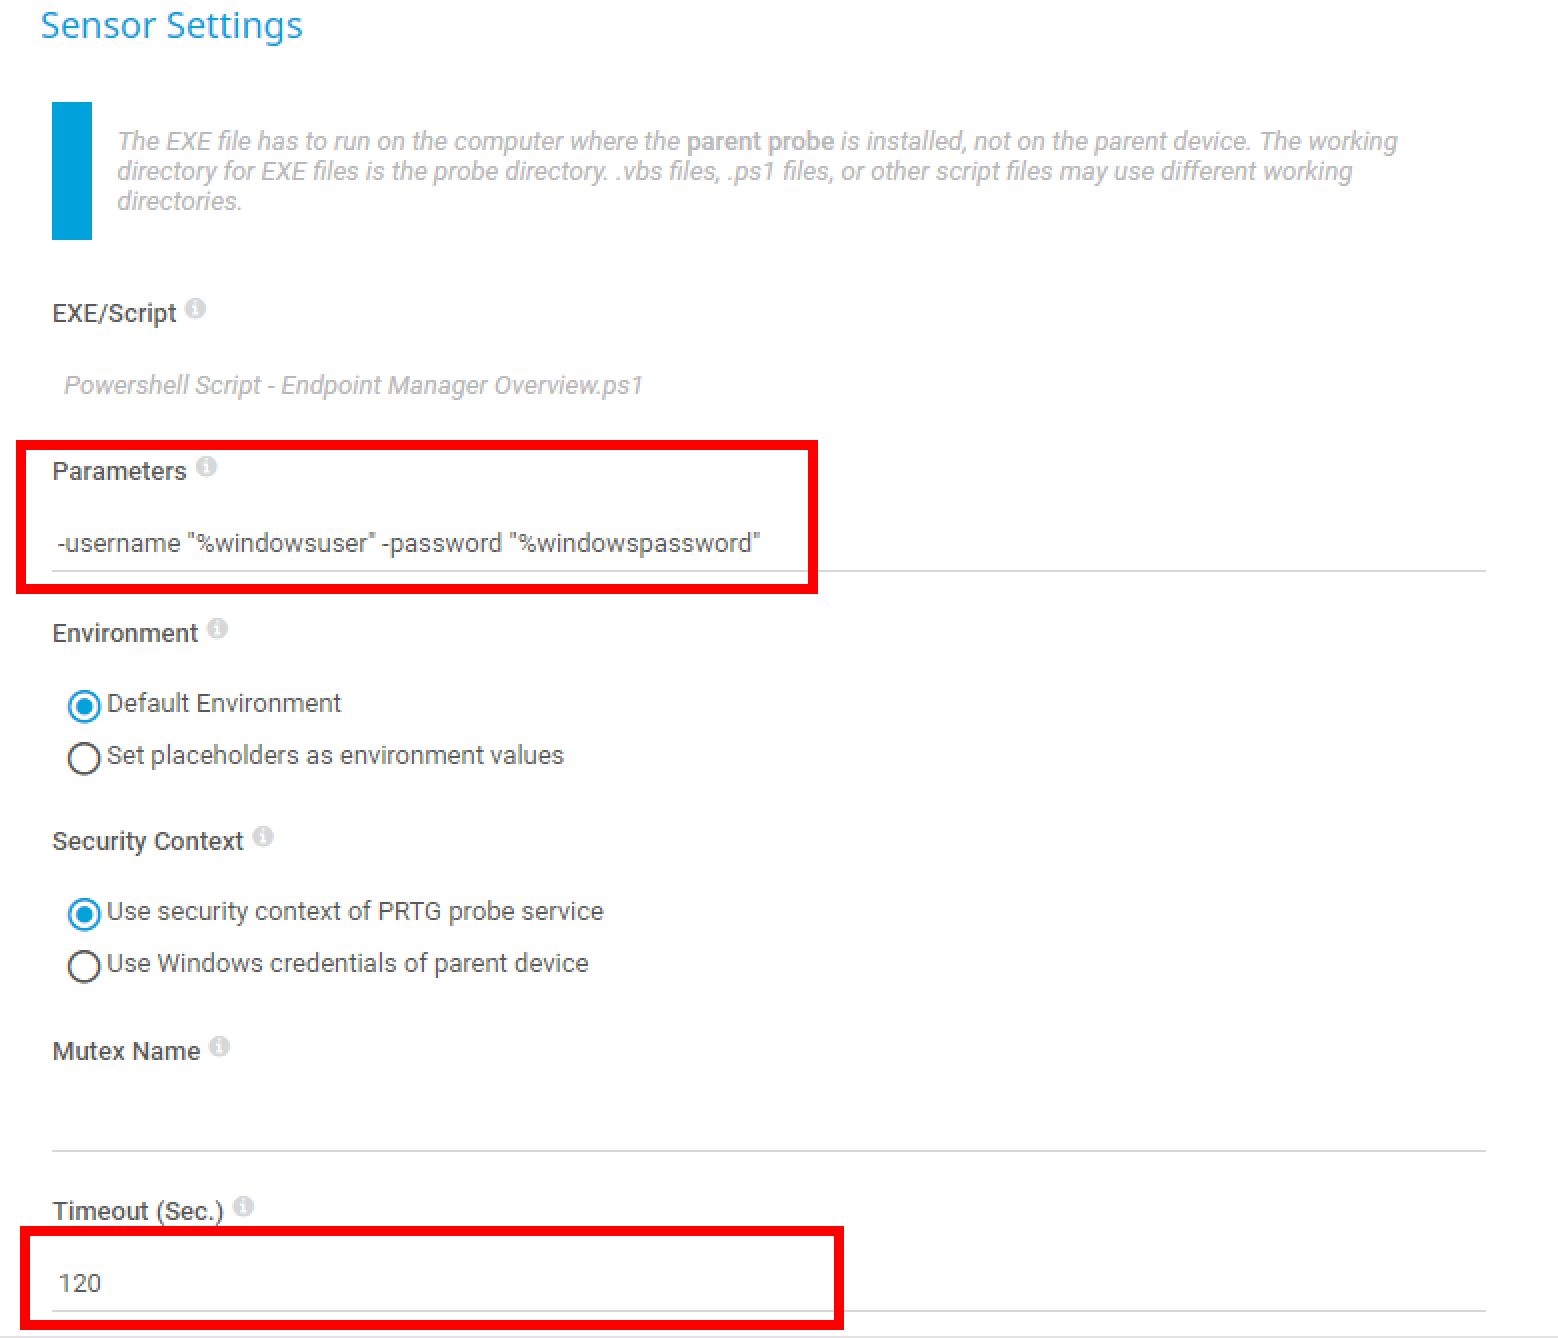
Create Sensor
- Create a new EXE/Script Advanced sensor for the device.
- Select “Powershell Script – Endpoint Manager Overview.ps1” for the script selection.
- V1 (didn’t use a service principal – just a normal user without MFA)
In the parameter field, enter -username “%windowsuser” -password “%windowspassword”. - v2
Enter in parameter field:
-app_id “<%azure_application_id>”
-tenant_id “<%azure_tenant_id>”
-client_secret “<%azure_application_client_secret>” - Increase timeout from 60s to 120s.
- Configure the interval to suit your needs, e.g. once every hour.
The alerts are individual, so the desired thresholds should be defined in the channel settings under Value Lookups and Limits. https://www.paessler.com/manuals/prtg/sensor_channels_settings
If everything went well, the desired indicators can be seen in the monitoring:
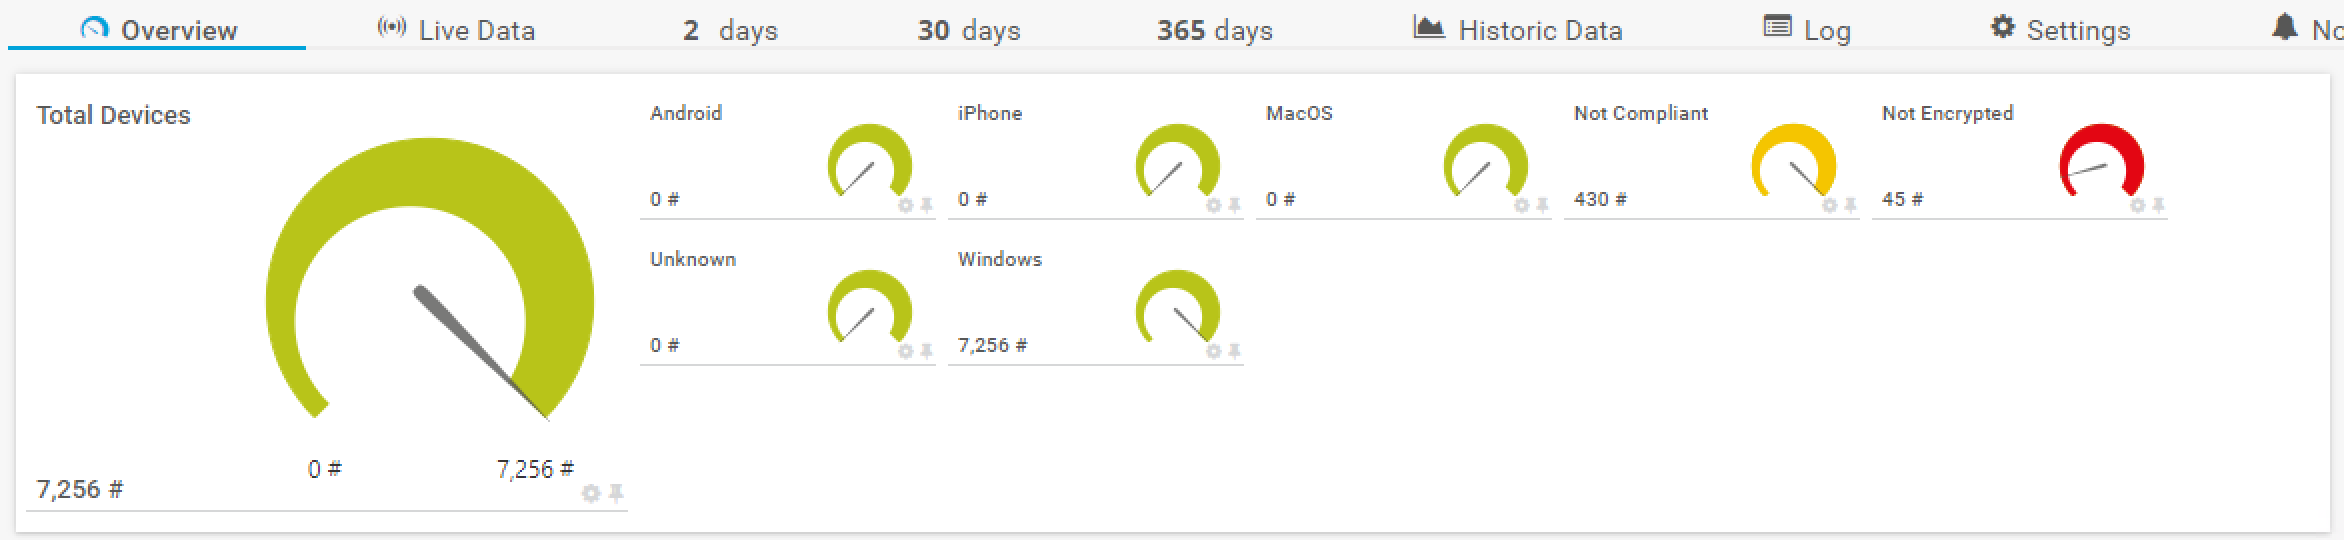
- Number of managed devices (Windows, MacOS, iOS, Android)
- Number of devices by operating system
- Number of devices that are not compliant
- Number of devices that are not encrypted
Important Microsoft Endpoint Manager information is displayed in the monitoring with little effort and an alarm is triggered by email, ticket, Microsoft Teams, etc. when a defined threshold value is exceeded.