NGINX Ingress WAF (Part 2) - mod_security Kibana Dashboard
How to create a security dashboard for your kubernetes ingress taffic and web application firewall (waf)

In the first part of the blog (Kubernetes NGINX Ingress Hardening with Mod_Security WAF and OWASP CRS), we configured our NGINX Ingress Controller on Kubernetes so that the WAF (Web Application Firewall) is activated and our webapps are protected from attacks. Now let’s build a Kubernetes NGINX Ingress WAF Dashboard.
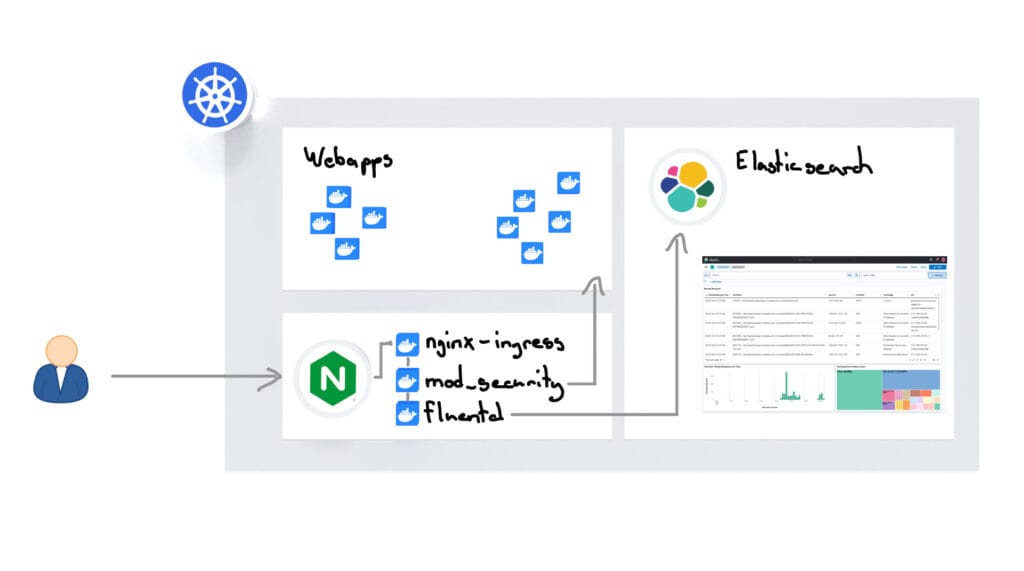
Today in the second part it is about getting a better overview of current attacks and the activity of our WAF. To do this, we attach a Fluentd sidecar container to the NGINX ingress controller, which monitors the ModSecurity WAF log and sends new events to the Elasticsearch cluster. We also add the fluentd geoip plugin so that attackers’ IP address is resolved to a location so that we can later display a world map in Kibana with the Attack Origins. The result is a Kibana dashboard that provides a good overview of Web Application Firewall (WAF) activity.

Custom Build - FluentD
We add our own Fluentd sidecar container to the NGINX ingress controller in Kubernetes, which monitors the ModSecurity log and sends all events to the Elasticsearch cluster. To do this, we create a Fluentd Custom Build Container, which has a plugin installed to interpret the ModSecurity logs, as well as a GeoIP plugin to resolve the geo-location using the IP addresses of the attackers.
We have an example repository here that you can use to build the FluentD container with the necessary dependencies. Then we upload the container image to our Google Container Repository:
docker build -t gcr.eu.io/meinprojekt/docker-modsec-fluentd:1.4 .
docker push gcr.eu.io/meinprojekt/docker-modsec-fluentd:1.4
Configmap for FluentD
First we create the fluent.conf and make it available in Kubernetes using a configmap. The config ensures that all entries from /var/log/modsecurity_audit.log are read out, formatted, a GEO IP is resolved and the result is saved in Elasticsearch.
apiVersion: v1
kind: ConfigMap
metadata:
  name: nginx-log-fluentd-config
  namespace: ingress-nginx
data:
  fluent.conf: |
    # (1) Consume the input

      @type tail
      tag raw-modsec
      path /var/log/modsecurity_audit.log

        @type multiline
        format_firstline /^-{2,3}[a-zA-Z0-9]{8}-{2,3}A--$/
        format1 /(?.*)/


    # (2) Massage it via this plugin to a more structured object

      @type modsecurity-audit-format
      tag modsec-formatted


      @type grep


        key sourceIp
        pattern /127.0.0.1/


      @type geoip
      geoip_lookup_keys  sourceIp
      backend_library geoip2_c
      log_level         info


        city            ${city.names.en["sourceIp"]}
        latitude        ${location.latitude["sourceIp"]}
        longitude       ${location.longitude["sourceIp"]}
        location_properties  '{ "lat" : ${location.latitude["sourceIp"]}, "lon" : ${location.longitude["sourceIp"]} }'
        country         ${country.iso_code["sourceIp"]}
        country_name    ${country.names.en["sourceIp"]}
        postal_code     ${postal.code["sourceIp"]}
        region_code     ${subdivisions.0.iso_code["sourceIp"]}
        region_name     ${subdivisions.0.names.en["sourceIp"]}

      #skip_adding_null_record true
      add_tag_prefix          geoip.
      flush_interval          5s


    # (3) Output to stdout

      @type elasticsearch
      hosts "#{ENV['ES_HOSTS']}"
      user "#{ENV['ES_USERNAME']}"
      password "#{ENV['ES_PASSWORD']}"
      port "443"
      ssl_verify false
      scheme https
      ssl_version TLSv1_2
      protocol https

      flush_interval 5s
      with_transporter_log true
      type_name doc
      logstash_prefix modsecurity
      logstash_dateformat %Y.%m
      logstash_format true
      include_timestamp true

      reconnect_on_error true
      reload_on_failure true
      reload_connections false


      @type stdout
FluentD Sidecar Container
Now the NGINX Ingress Controller Deployment on Kubernetes is configured so that all containers can access the Modsecurity Log. We also attach the previously created FluentD container as a sidecar container:
- name: fluentd-modsec
  image: my-container-registry.com/docker-modsec-fluentd:1.4
  command:
  - fluentd
  - '-c'
  - /etc/fluentd/fluent.conf
  env:
  - name: ES_HOSTS
    value: https://elastic.*****.com:443
  - name: ES_USERNAME
    value: elastic_user
  - name: ES_PASSWORD
    value: ********
  volumeMounts:
  - name: nginx-logdir
    mountPath: /var/log
  - name: nginx-log-fluentd-config
    mountPath: /etc/fluentd/fluent.conf
    subPath: fluent.conf
Elasticsearch Configuration
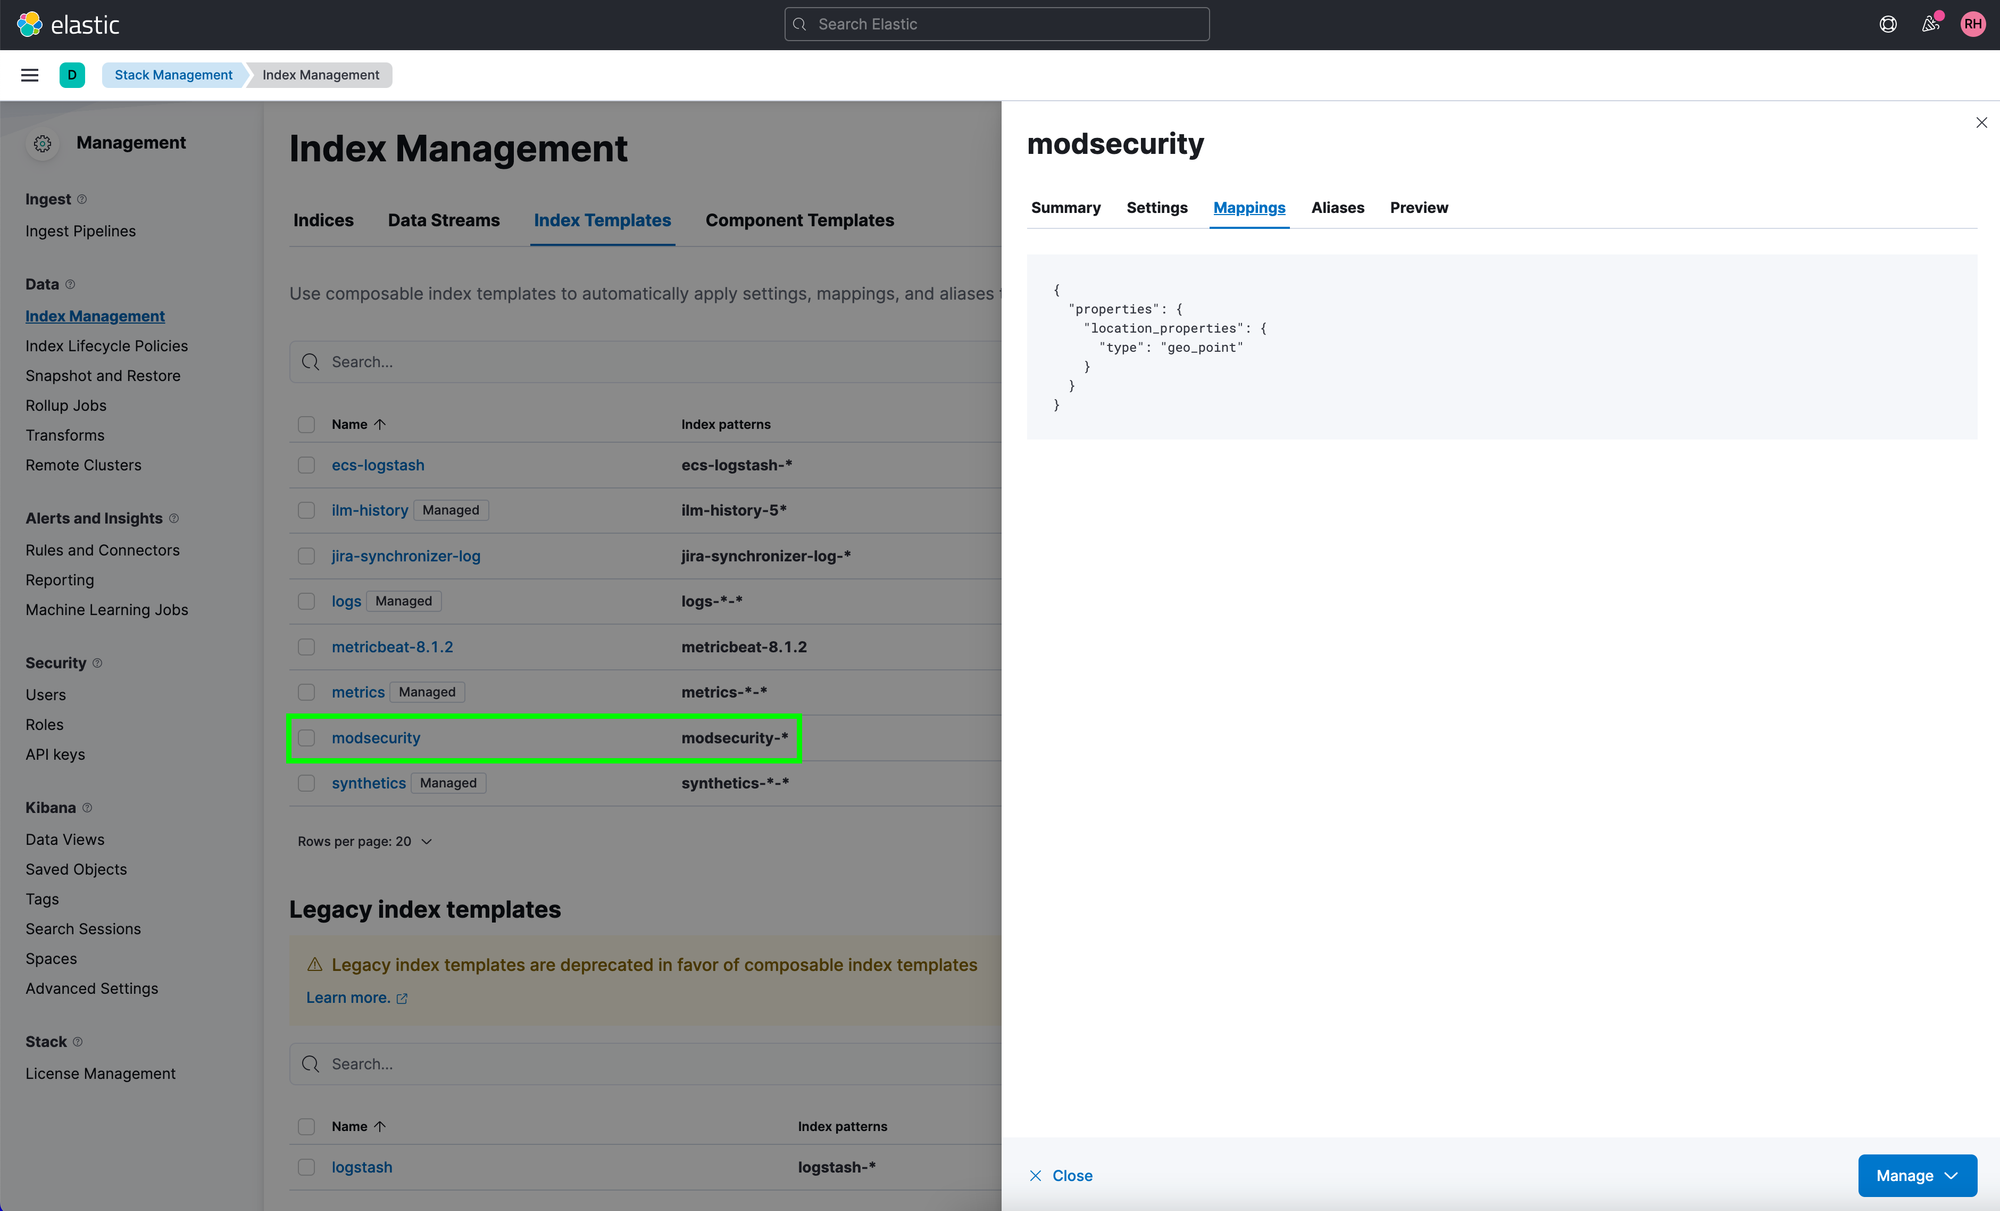
In Elasticsearch, we use an index template to ensure that the mapping of the “location_properties” field is later defined as “geo_point” in the index.
Kubernetes NGINX Ingress WAF Dashboard
If everything is now configured correctly, the NGINX Ingress Controller (or the FluentD Sidecar Container) will now send all logs to the Elasticsearch Cluster. In Kibana, you can now use the data to configure a Kubernetes NGINX Ingress WAF dashboard that displays the data.