Kubernetes - Cronjob Monitoring
How to achieve Kubernetes Cronjob Monitoring and create a job dashboard with prometheus and grafana.


How long has it been since a Kubernetes cronjob last ran successfully?
Today a short blog post on Kubernetes Cronjob Monitoring.
Today’s blog is interesting for you if you want to monitor your Kubernetes cronjobs with the popular monitoring stack from Prometheus Operator (Prometheus Agent, Service Detection, Grafana).
opensight.ch – roman hüsler

Kubernetes Cronjobs
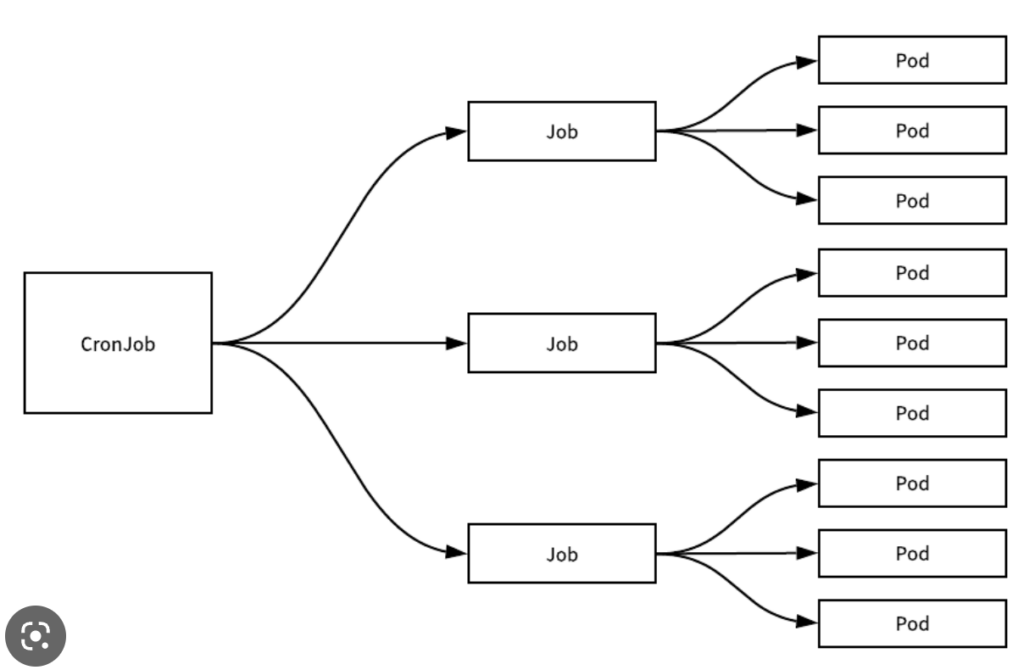
A cron job defines a schedule in Kubernetes (very similar to Linux Cron Jobs), according to which a job should be executed periodically. When the execution time has come, Kubernetes will automatically create a job object, which in turn will create one or more pods for execution. So we’re interested in when the job was last started and whether the run (pod) completed successfully. On the Kubernetes side, we are dealing with objects of the “CronJob”, “Job”, “Pod” type.
The challenge is that the desired information cannot be easily retrieved from one metric, rather several metrics must be combined together. We will use the following 4 metrics to reach our goal:
- kube_job_status_start_time
- kube_job_labels
- kube_pod_labels
- kube_pod_status_phase
Prerequisites for Kubernetes Cronjob Monitoring
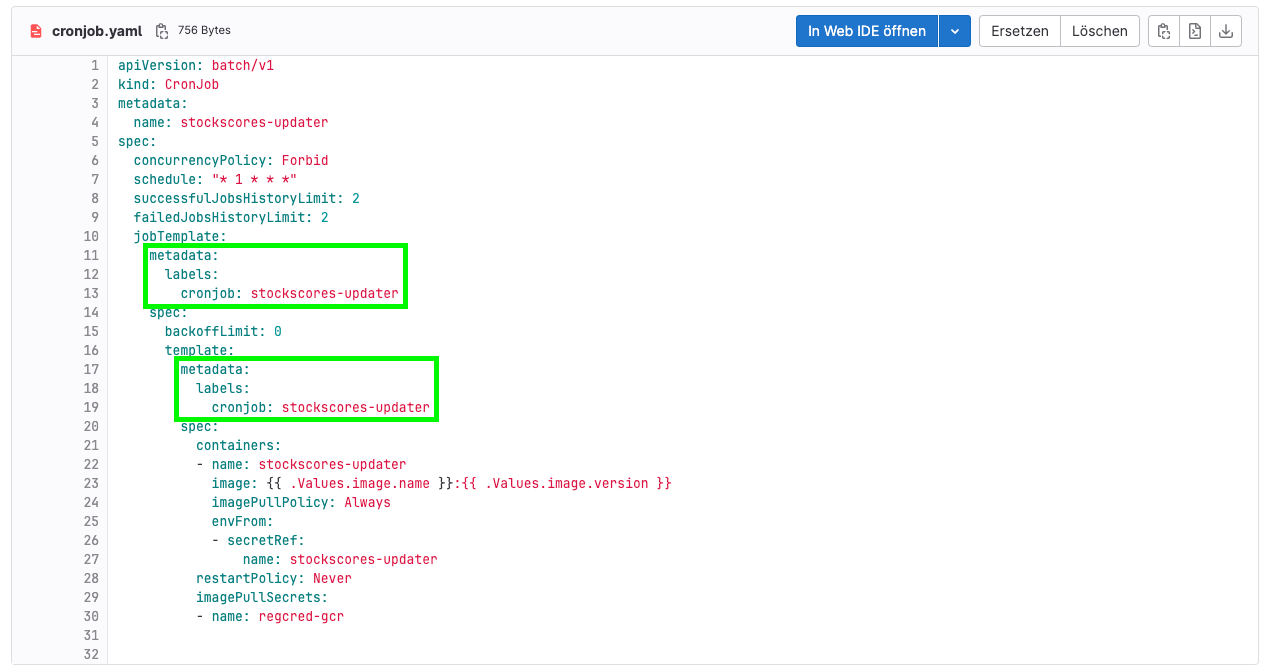
First, we should label the Kubernetes manifest of our cron job with some labels so that we can later find this specific job in the metrics:
Combination of Metrics
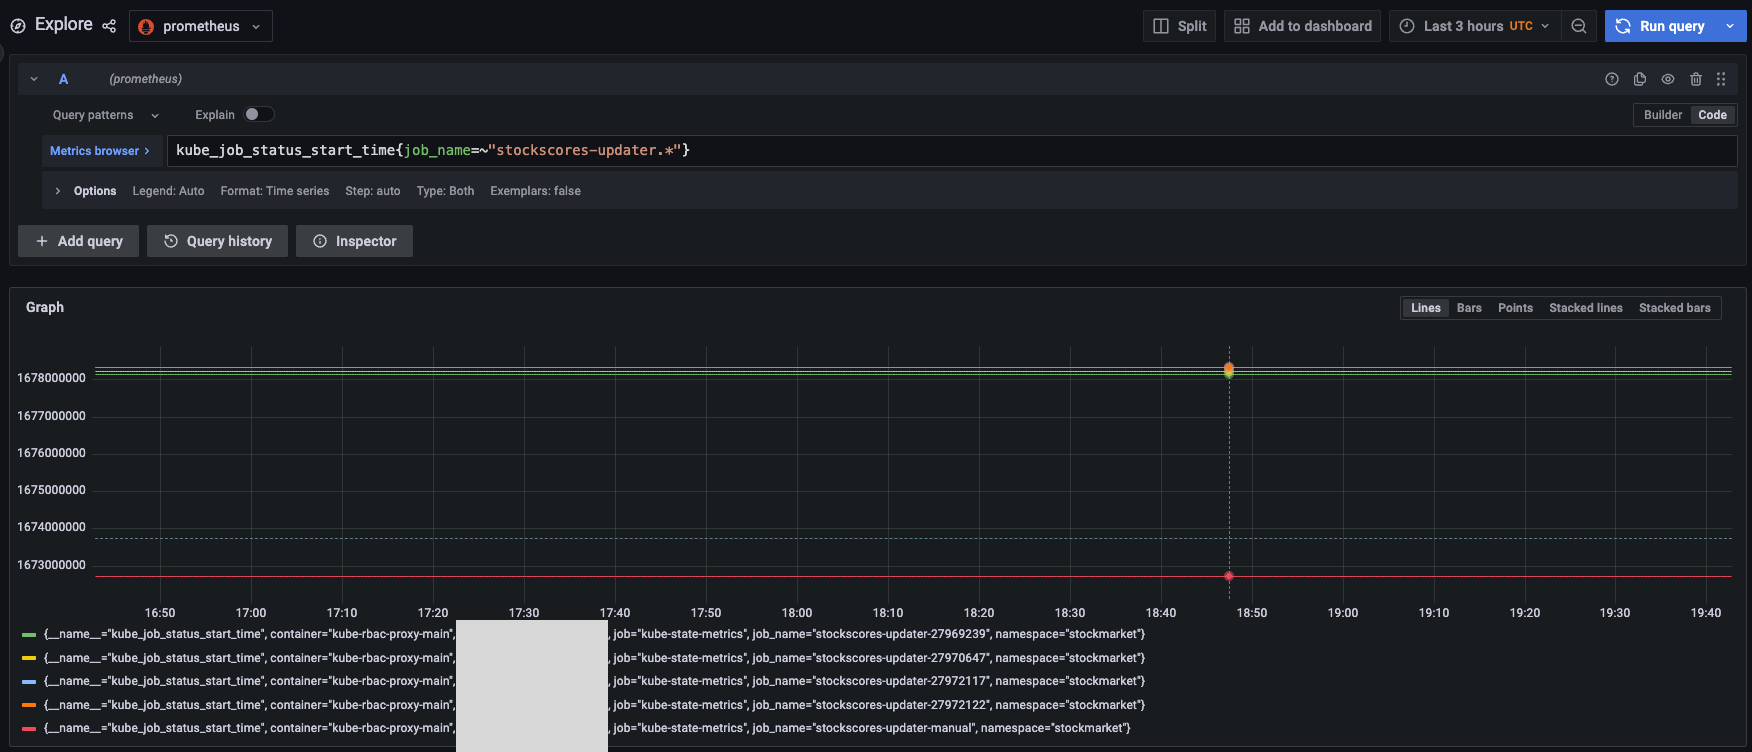
kube_job_status_start_time{job_name=~"stockscores-updater.*"}The metric “kube_job_status_start_time” returns the Unix timestamp of the last job executions, generated by the cronjob. But which ones were completed with the status “Succeeded”? To find out, you have to assign the jobs to the generated pods and retrieve the status code of the same.
First we search in the metric “kube_job_labels” to find all jobs with the label “cronjob=stockscores-updater” (see Prerequisites) generated by the cronjob and combine that with the above metric (kube_job_status_start_time). Due to the GROUP_RIGHT statement, the “kube_job_labels” metric has a higher cardinality and we continue with their labels, but with the metric value (unix timestamp) of kube_job_status_start_time.
kube_job_status_start_time
  * ON(job_name) GROUP_RIGHT()
    kube_job_labels{label_cronjob="stockscores-updater"}
Now we look for all pods with the label “cronjob=stockscores-updater” in the metric of the pod labels (see Prerequisites)
kube_pod_labels{label_cronjob=~"stockscores-updater"}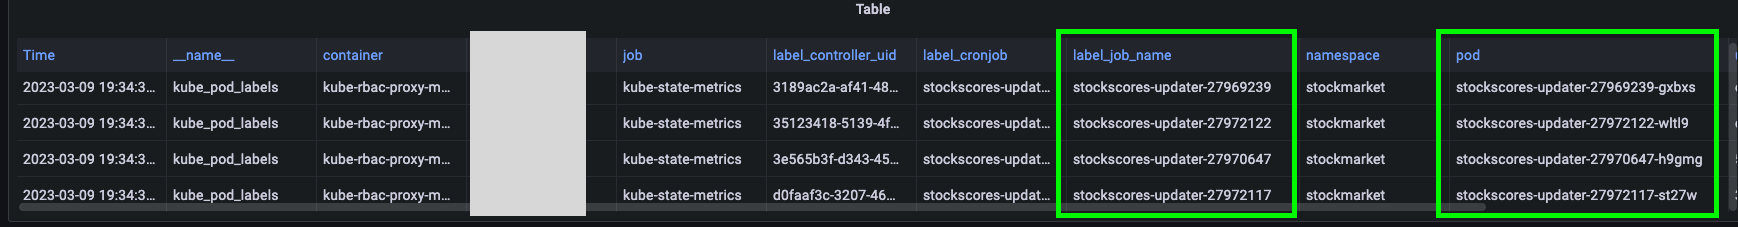
We can see here that the label is unfortunately called “label_job_name”, which should actually be called “job” name so that we can match and continue our query from above. We need to use “label_replace”…
kube_job_status_start_time
  * ON(job_name) GROUP_RIGHT()
    kube_job_labels{label_cronjob="stockscores-updater"}
    * ON(job_name) GROUP_RIGHT()
      label_replace(kube_pod_labels, "job_name", "$1", "label_job_name", "(.*)")
Now we have the query at a point where we can match the pod name to the last job start time. We just want to filter out those entries where the pod’s execution was also successfully completed:
kube_job_status_start_time
  * ON(job_name) GROUP_RIGHT()
    kube_job_labels{label_cronjob="stockscores-updater"}
    * ON(job_name) GROUP_RIGHT()
      label_replace(kube_pod_labels, "job_name", "$1", "label_job_name", "(.*)")
      * ON(pod) GROUP_RIGHT()
        kube_pod_status_phase{job="kube-state-metrics",phase=~"Succeeded"}
Kubernetes Cronjob Monitoring - Wrapping up
At this point we now have a metric with the Unix timestamp (start time) of all successfully executed pods of the cron job. We can now use this data to calculate the time since the last successful execution and have our Kubernetes Cronjob Monitoring completed.
# k8s cronjob - time since last successful execution
time() - max(
kube_job_status_start_time
* ON(job_name) GROUP_RIGHT()
kube_job_labels{label_cronjob="stockscores-updater"}
* ON(job_name) GROUP_RIGHT()
label_replace(kube_pod_labels, "job_name", "$1", "label_job_name", "(.*)")
* ON(pod) GROUP_RIGHT()
kube_pod_status_phase{job="kube-state-metrics",phase=~"Succeeded"}
)
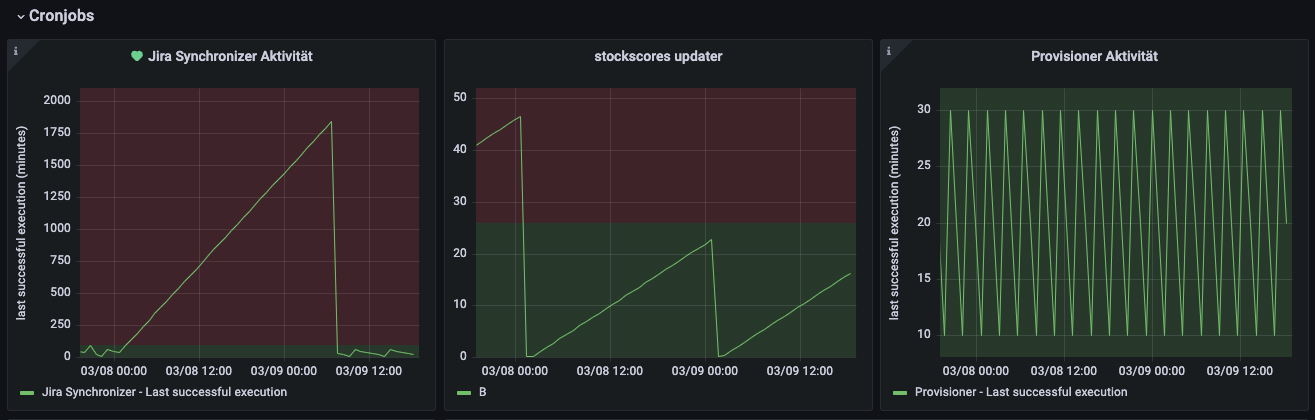
BY (job_name, label_cronjob)This usually results in the classic sawtooth pattern, which shows the time since the last successful execution.
We hope you got some insights about Kubernetes Cronjob Monitoring. Checkout our other Devops Blogs at opensight.ch/blog/category/devops