PRTG Monitoring - Intune App Installation States
How you can use PRTG to monitor your intune apps and their rollout status on your intune managed devices


How you can use PRTG to monitor your intune apps and their rollout status (device states)

When you rollout an application with microsoft intune you might wanna use your existing monitoring to have an overview of the rollout states, in order to see, whether your installations run well on the devices. One option is to use PRTG Monitoring for Endpoint Manager (Intune).
With the management of the work devices by Microsoft Endpoint Manager (Intune), there is also the possibility of having endpoint manager information in your existing PRTG monitoring.
To monitor the indicators, we use monitoring software from Paessler. PRTG monitors data traffic, availability and performance of devices and applications in IT infrastructures. This includes monitoring for classic network devices such as servers, routers, switches and firewalls, as well as virtual environments and also – as in this example – you can use the right scripts to monitor cloud components such as Microsoft Endpoint Manager.
In this example, we would like to measure the following Microsoft Endpoint Manager indicators with PRTG:
- Overall - Installation State
Installation State of "all apps" / overall on the devices. According to the documentation, the state can be one of the following:
"installed", "failed", "notInstalled", "uninstallFailed", "pendingInstall", "unknown", "notApplicable".
Our script allows to filter the states you desire to measure in PRTG and also a "total" by spefifying the script parameter "-states" (examples below) - By Product - Installation State
Measure the Installation state of specific Apps with PRTG. Our Script allows to filter out Apps by the script parameter "-softwarenames". The parameter also allows to use "all" to show all detected apps from intune or "overall" to show the status over all apps in total. (examples / use cases below)
So let's now check some usecases.
Use Cases
Rollout Status of specific App - 7zip
In order to show the rollout state of the specific app we can use the following parameters:
v1_prtg_intune_app_status.ps1 -states 'total;installed;failed;pendingInstall;unknown;notApplicable' -softwarenames '7zip 22'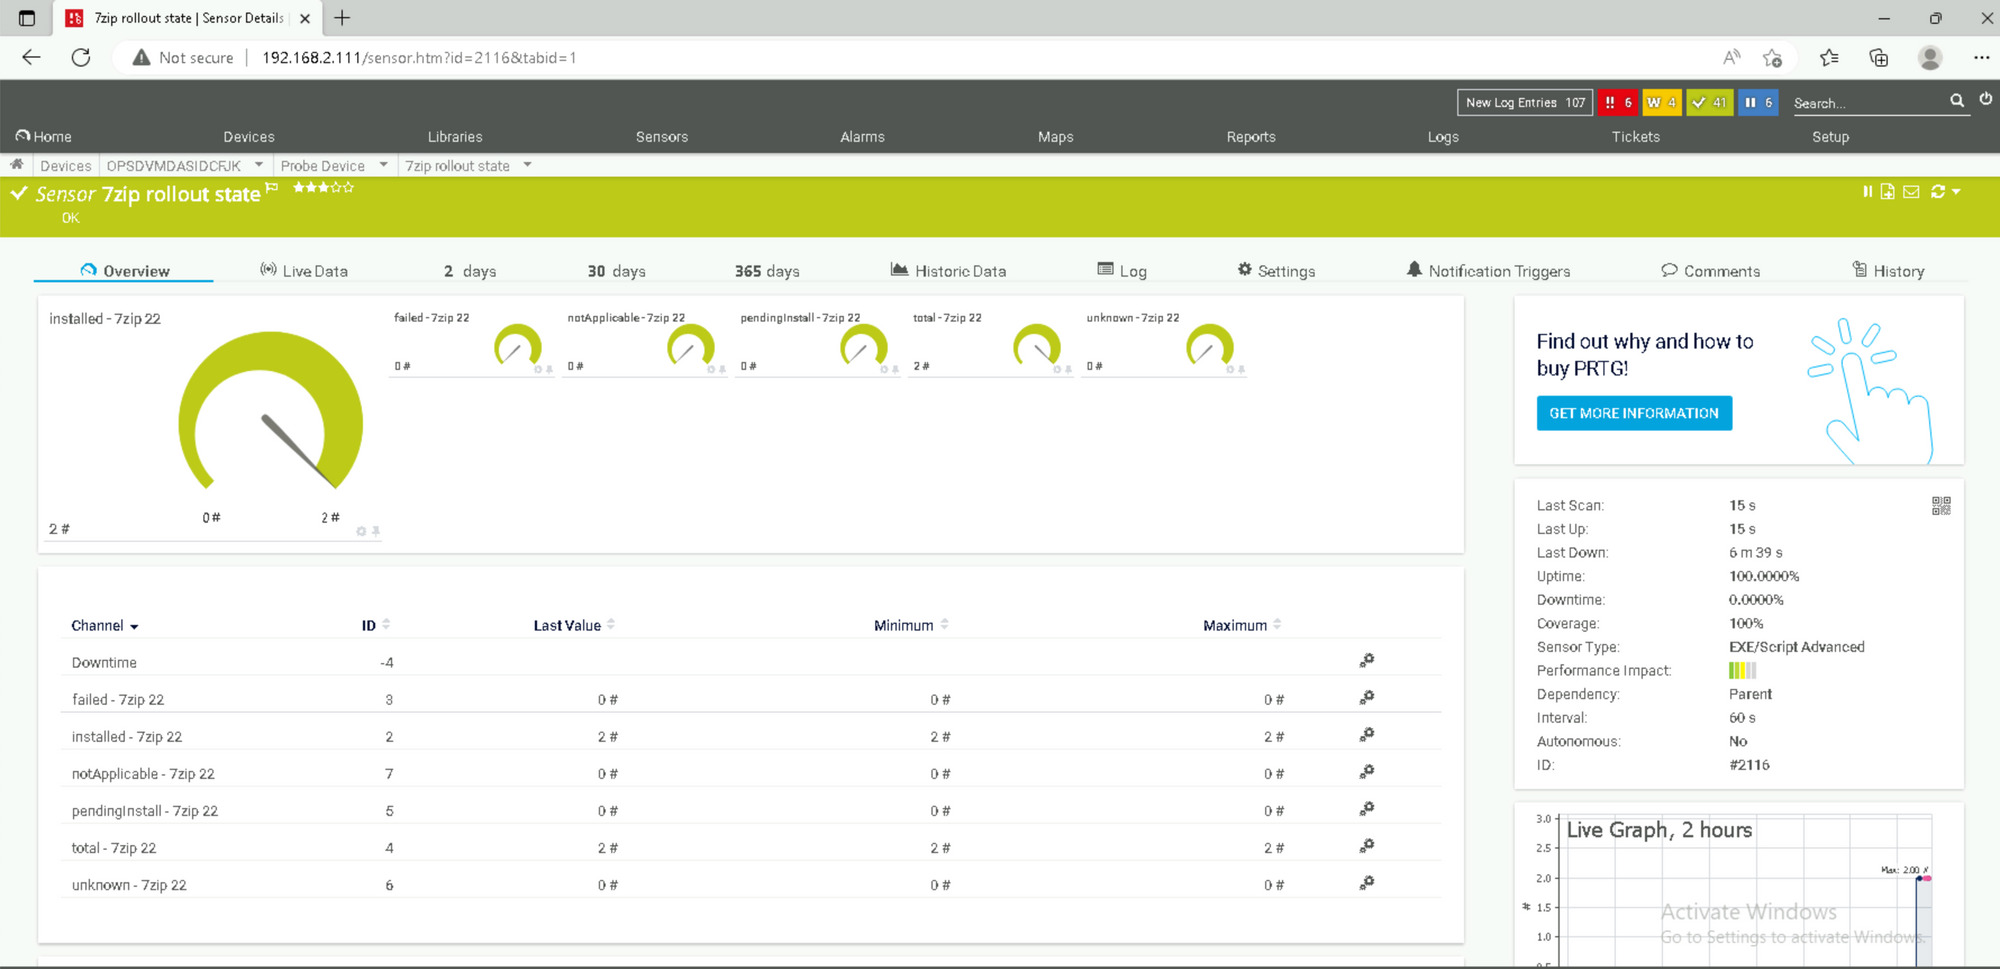
We could also show several or even all software by specifying multiple software names (-softwarenames '7zip 22;winscp') or just (-softwarenames 'all').
Installation Status Overall
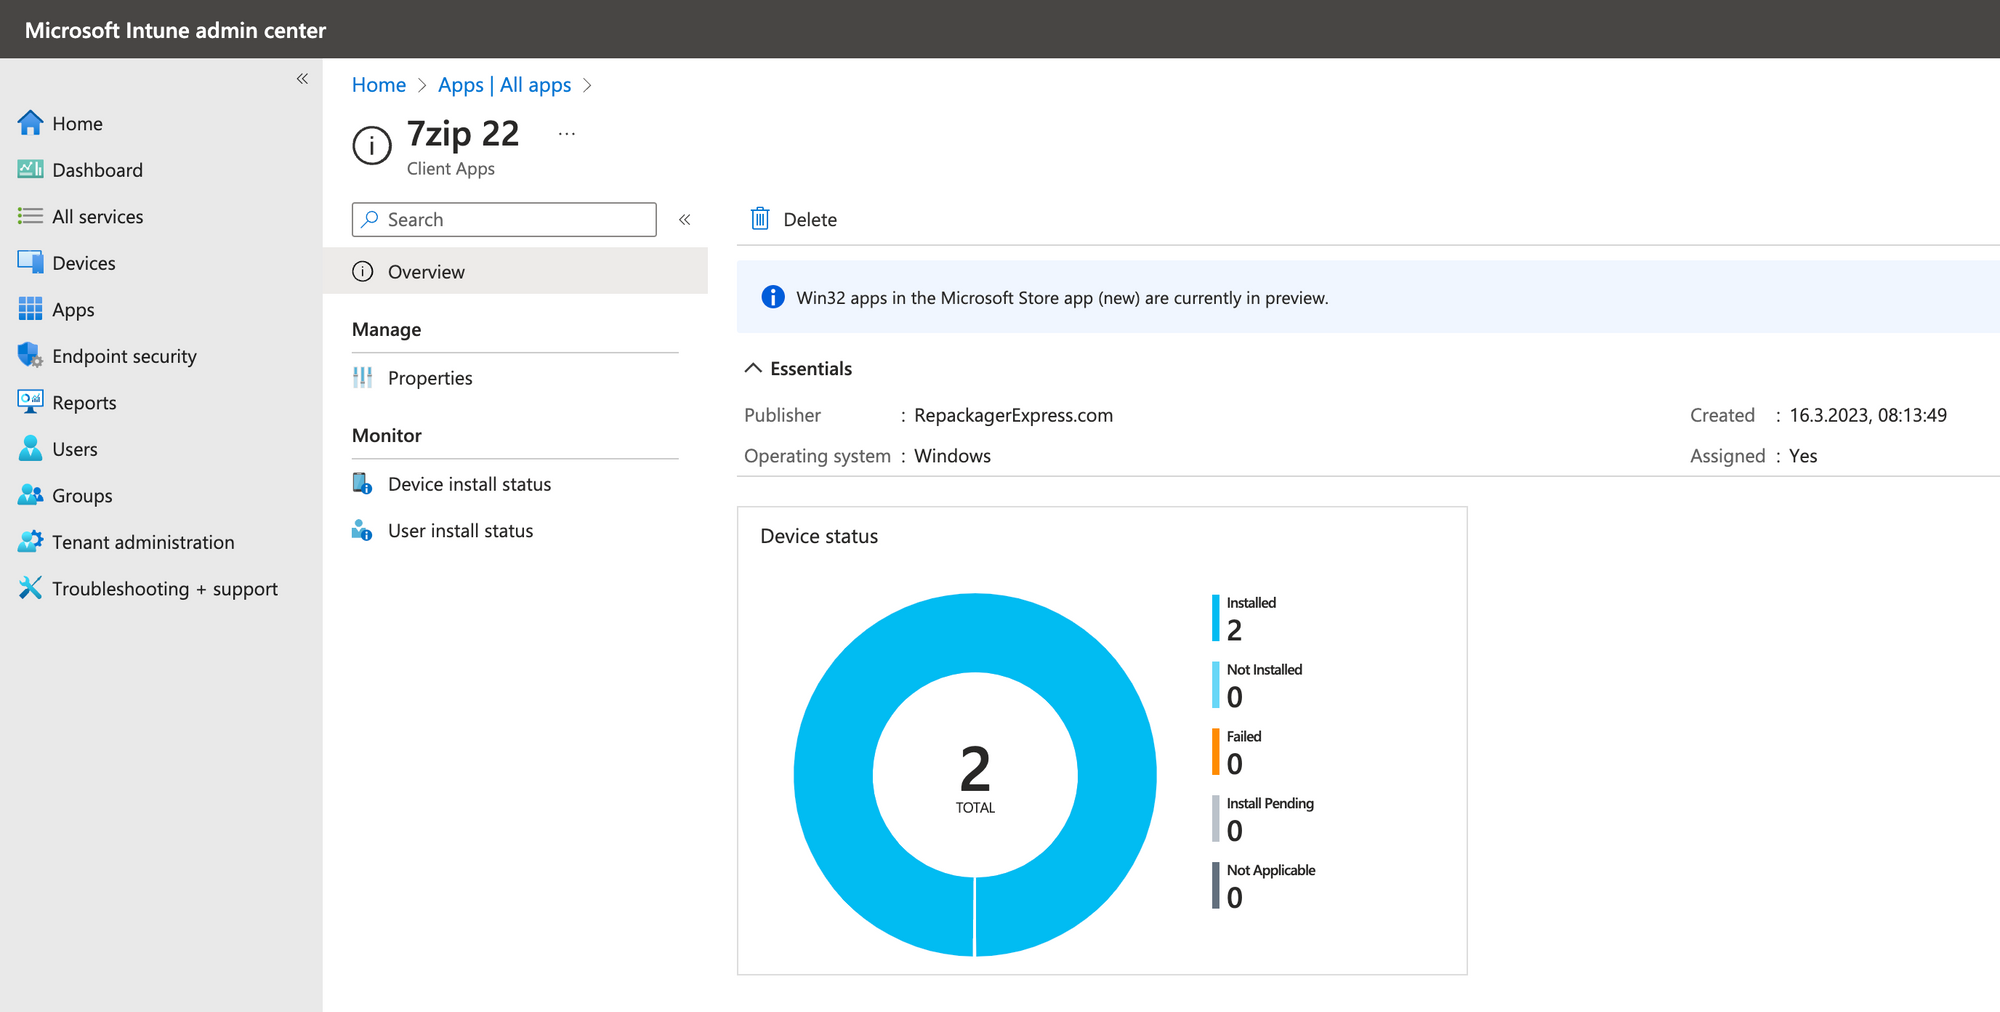
Lets Check the installation Status of all software packages overall. In our test environment we have 2 software packages assigned to 2 devices. Like you can see on the screenshot below, we have therefore 4 "installed" states in total so everything is fine. This was achieved with the following script parameters:
v1_prtg_intune_app_status.ps1 -states 'installed;failed;total;pendingInstall;unknown;notApplicable' -softwarenames 'overall'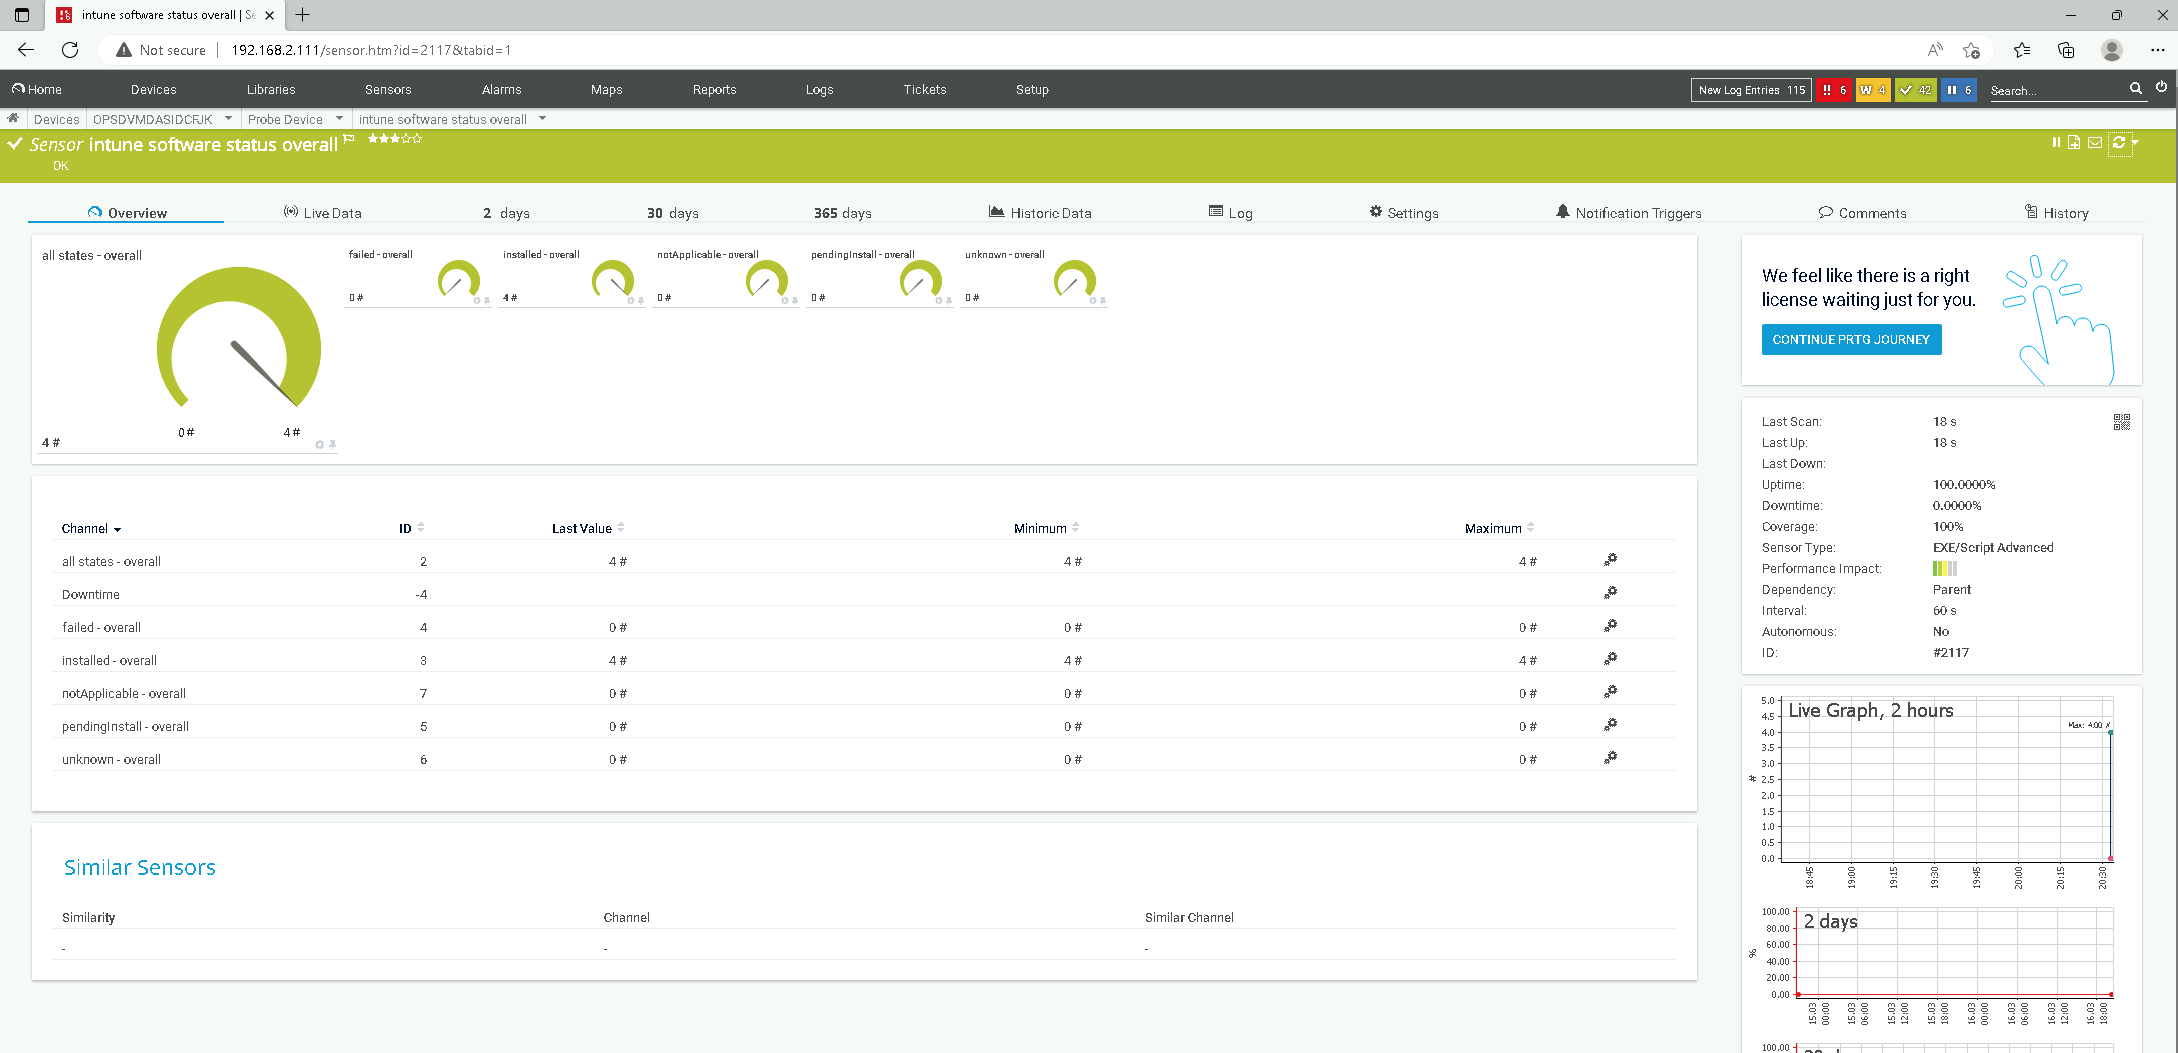
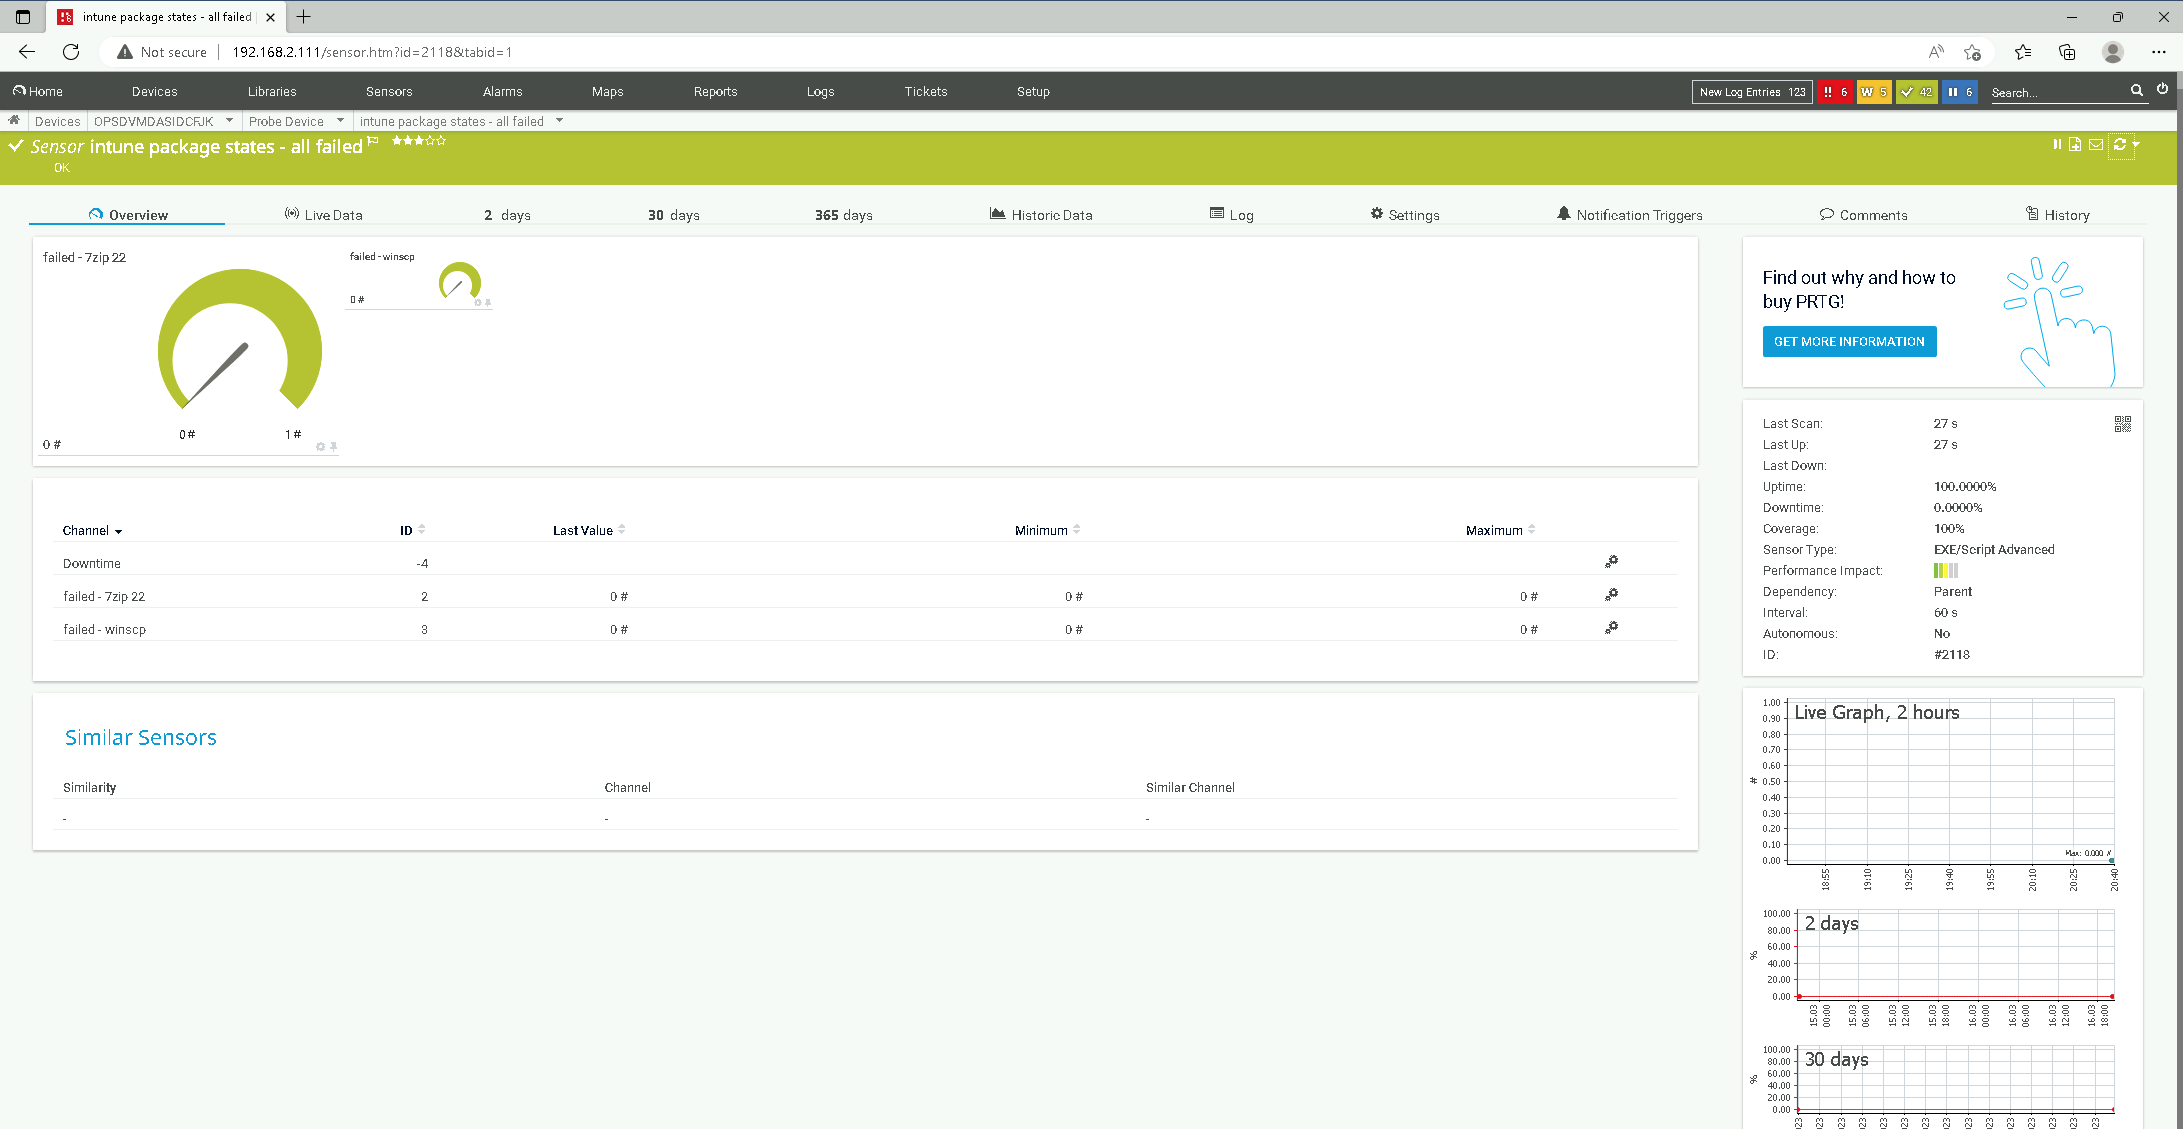
Show all failed Installations
Finally - Lets do a dashboard for all failed installations so you get the drift for the script parameters. New apps in intune will appear automatically because we specified -softwarenames 'all':
v1_prtg_intune_app_status.ps1 -states 'failed' -softwarenames 'all'Unfortunately, there's not much to see because we have no failed installs right now for our packages "winscp" and "7zip 22".
Hail Mary - Just for fun
Ok - just for fun one more that just shows just everything. Even though we have just 2 packages in the test environment it can get crowded.
v1_prtg_intune_app_status.ps1 -states 'all' -softwarenames 'all;overall'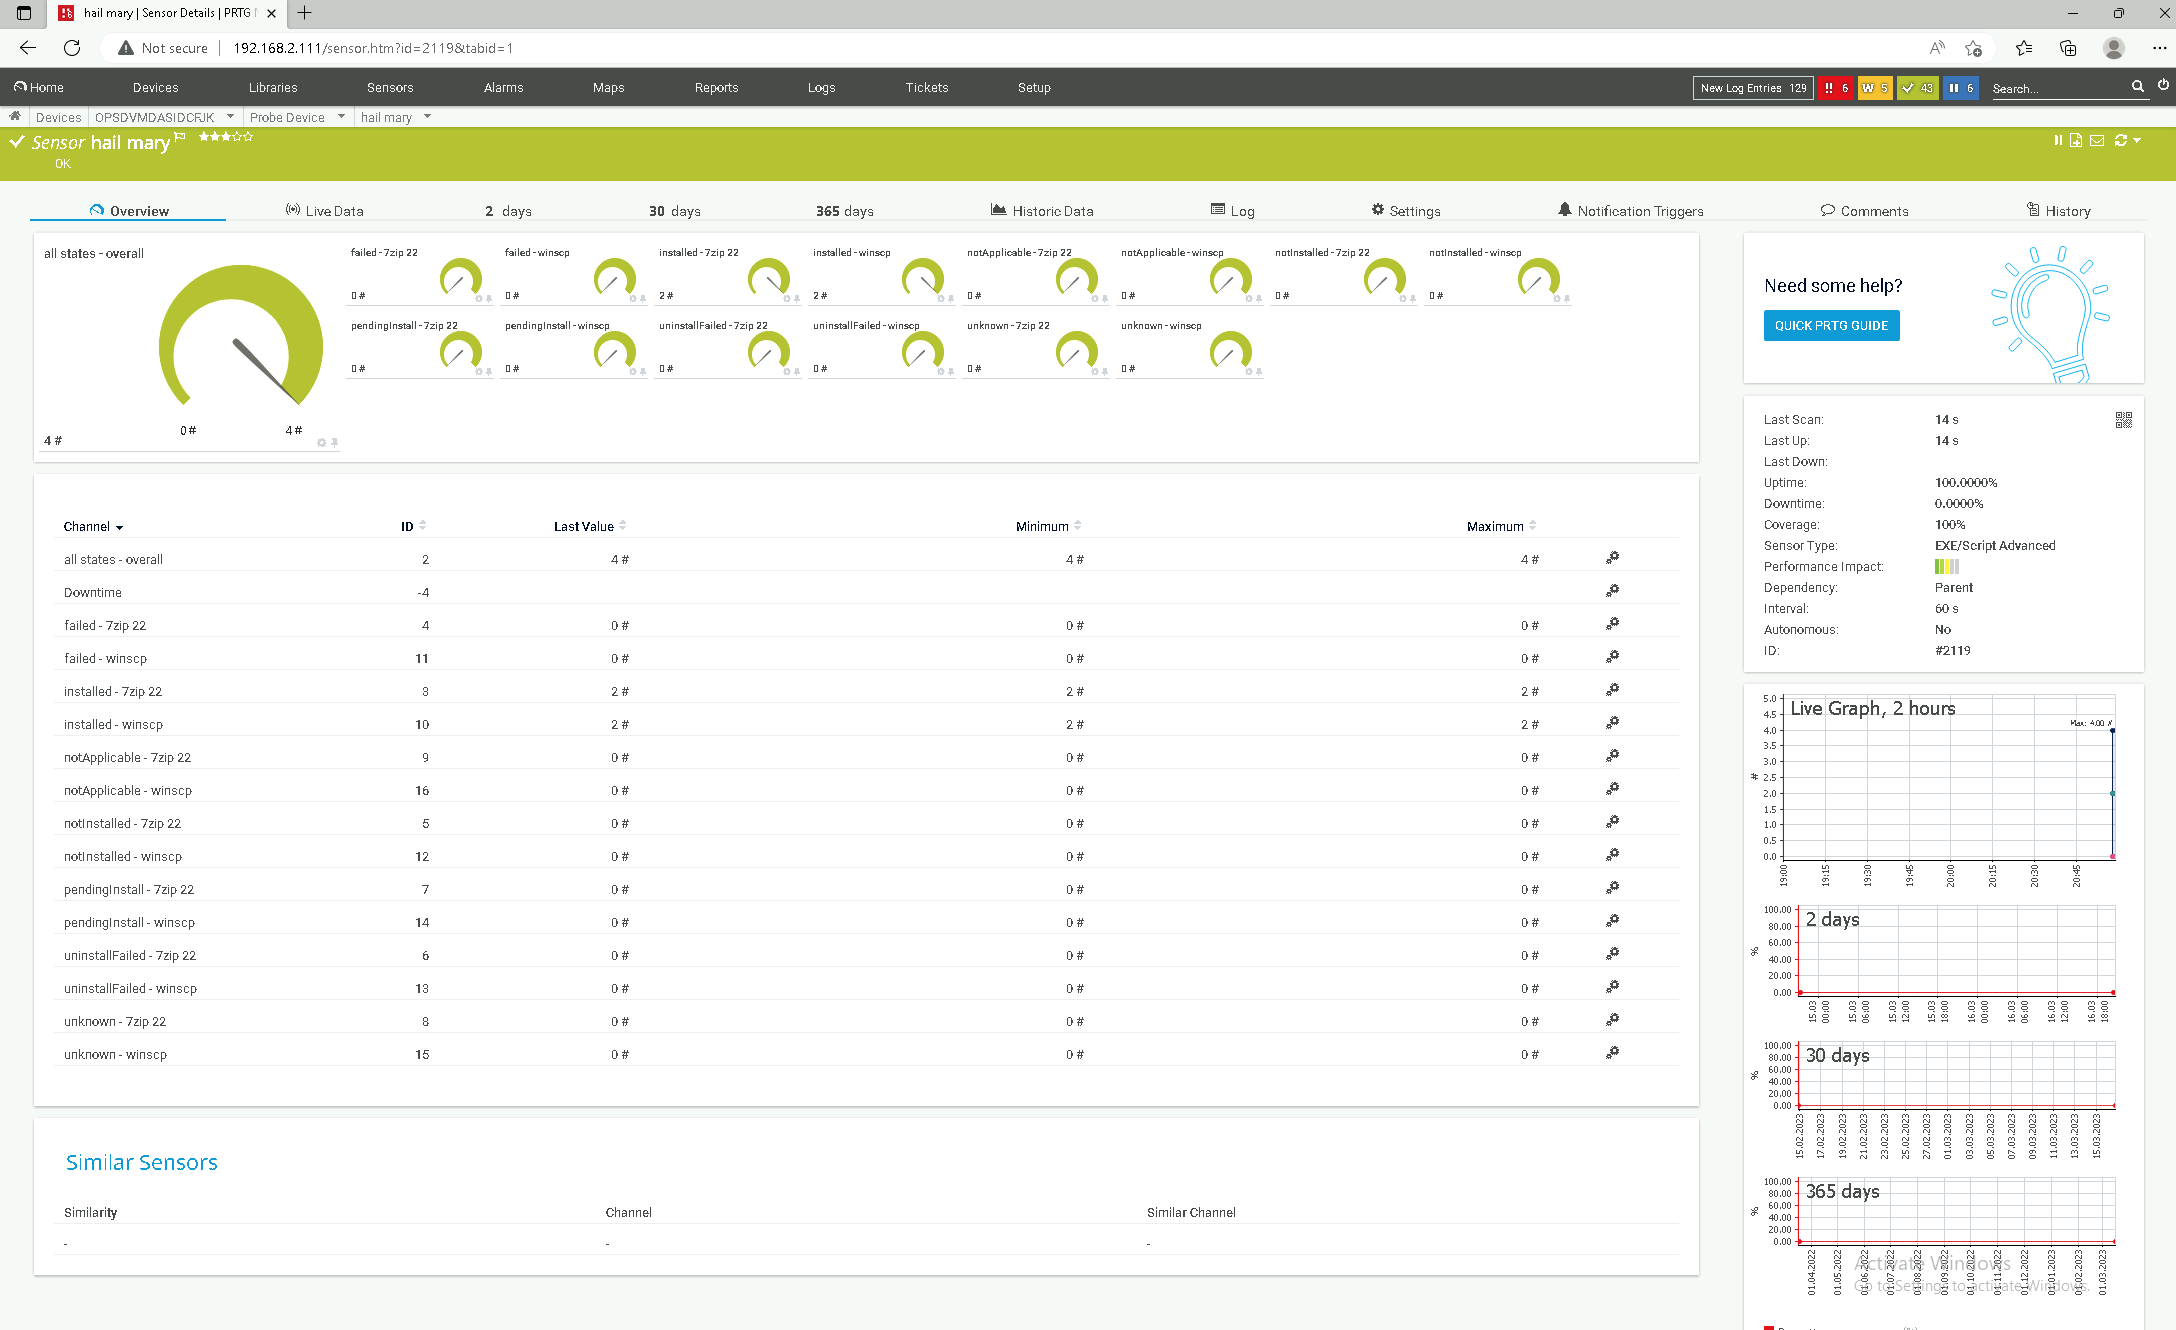
Prerequisites
A Service Principal (app registration) is required in Azure AD in order to be able to read out the desired indicators. This must have the appropriate read permissions in the Microsoft Graph API.
https://learn.microsoft.com/en-us/azure/active-directory/develop/app-objects-and-service-principals
The Powershell module «MSAL.PS» is installed on the PRTG server or the PRTG probe. It is the Microsoft Authentication Library module, which is required so that the script can retrieve an access token.
Install-Module MSAL.PS -Scope AllUsers -ForcePowershell - Install MSAL Library (Microsoft Authentication Library)
The script uses this library at one point to get an access token:
# acquire azure authentication token
$MsalToken = Get-MsalToken -TenantId $tenant_id -ClientId $app_id -ClientSecret ($client_secret | ConvertTo-SecureString -AsPlainText -Force)

#Connect to Graph using access token
Connect-Graph -AccessToken $MsalToken.AccessToken
powershell - acquire azure authentication token
If an error message appears, NuGet cannot be installed, TLS 1.2 must first be enforced on the probe, where the script of the sensr will run.
[Net.ServicePointManager]::SecurityProtocol = [Net.SecurityProtocolType]::Tls12
Install-PackageProvider NuGet
powershell - enforce tls 1.2
service principal (app registraion)
Now a “Service Principal” (app registration) including Secret must be created in Azure Active Directory. During this process you will receive various information, which you then need to run the monitoring script so that it can access the information in Azure:
- application id (app_id)
- azure tenant id (tenant_id)
- application client secret (client_secret)
The creation of the Service Principal is described in detail in the download (readme).
Powershell Graph API
The desired Endpoint Manager indicators are provided by Microsoft via the Graph API. In the past, each product had its own API or even multiple APIs. Exchange knows EWS, REST, ActiveSync and MAPI/HTTP, Skype for Business has a UCWA and a UCMA and so the story can be told endlessly. Each API has its own URL, methods and format, and authentication mechanisms.
With Microsoft Graph, Microsoft wants to provide uniform access to all data via a REST interface. Our script will use the following endpoint:
https://graph.microsoft.com/V1.0/deviceManagement/managedDevicesThis is documented in more detail here at Microsoft.
PRTG Configuration
Create Sensor
- Create a new EXE/Script Advanced sensor for the probe, where our custom exexml script is installed.
- Select “Powershell Script – v1_prtg_intune_app_status.ps1” for the script selection.
- Fill in the parameter field:
-app_id '<%azure_application_id>'
-tenant_id '<%azure_tenant_id>'
-client_secret '<%azure_application_client_secret>'
-states 'all'
-softwarenames 'all;overall' - Increase timeout from 60s to 120s.
- Configure the interval to suit your needs, e.g. once every hour.
The alerts are individual, so the desired thresholds should be defined in the channel settings under Value Lookups and Limits. https://www.paessler.com/manuals/prtg/sensor_channels_settings
Important Microsoft Endpoint Manager information is displayed in the monitoring with little effort and an alarm is triggered by email, ticket, Microsoft Teams, etc. when a defined threshold value is exceeded.