Application Observability Tracing Auto Instrumentation
Exploring Application Observability in 2025: Can we achieve true zero-code distributed tracing & auto-instrumentation on Linux VMs? Tested OpenTelemetry Injector, eBPF tools like Beyla/OTel eBPF, and more. Progress is huge, but not fully magical yet.


Today, I'm exploring out-of-the-box tracing capabilities for application observability, along with RED metrics (Rate, Errors, and Duration). Ideally, this would involve deploying an agent and its configuration across Linux virtual machines, while enabling seamless service discovery and distributed tracing.
opensight.ch - roman huesler
Will that be possible to achieve? I share with you some experiences. For your convenience I have put some of the playbooks that were used into the GIT repository.
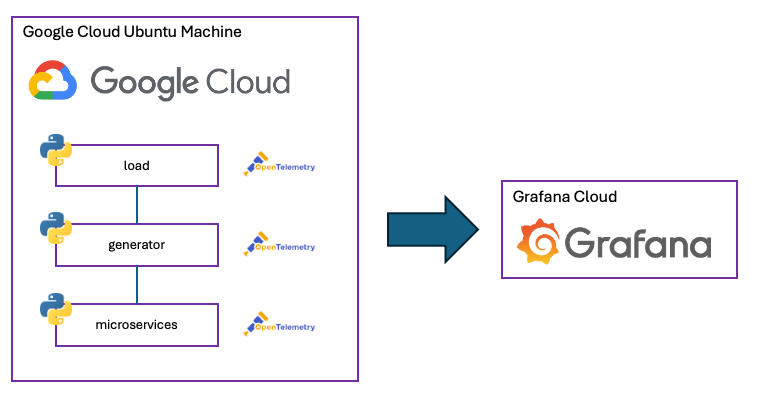
For this exploration, I set up an Ubuntu host running several microservices, with Grafana Cloud as the observability backend. The primary goal was straightforward: install a lightweight agent (or apply minimal configurations) on the virtual machine to automatically instrument whatever applications are running—delivering out-of-the-box distributed tracing, service discovery, and RED metrics (Rate, Errors, Duration) without requiring code changes.
TL;DR - The Reality Check In short, I wasn't able to fully achieve this "zero-touch" ideal. We made significant progress—getting partial auto-instrumentation working for some runtimes and solid metrics collection—but seamless, language-agnostic distributed tracing across all applications on the host still required more manual effort than expected.
As of late 2025, the technology has come a long way, but it's not quite "set it and forget it" yet for truly heterogeneous environments.
Content
- Installing Demo Application
Installing the microservices demo application that we will instrument with tracing - Grafana Alloy with Beyla eBPF
Deploy a Grafana Alloy agent on the vm and configure eBPF tracing - OpenTelemetry Zero Code Auto Instrumentation
Instrumenting the applications with opentelemetry zero code approach - OpenTelemetry Injector
First Contact with the opentelemetry injector - Key Take Aways
Installing Demo Application
I used a simple demo application: a password generator service available in this Git repository (repo link). It's built as a collection of Python Flask microservices, specifically designed for experimenting with tracing and instrumentation. A loader communicates with different backends in order to generate a password:
generatorgenerates the password by calling all the other services multiple timesspecialgenerates special charactersuppergenerates uppercase characterslowergenerates lowercase characters (and fails sometimes)digitgenerates digits
To start, I created an Ansible playbook named main_uninstrumented.yml This playbook deploys the entire password generator microservices application on a single Ubuntu machine, installing each service as a systemd unit file for reliable process management and automatic restarts.
Grafana Alloy with Beyla eBPF
Let's try to install an alloy agent on the vm that will observe and trace everything with eBPF technology - because that would be the golden goose right: we install an agent on all virtual machines and - done. It will gather all traces and create a service map for us. But as i soon noticed, the technology is not quite that far yet.
Take a look at main_instrumented_alloy.yml playbook in the repository, which was used to configure alloy.
My key takeaway from this approach:
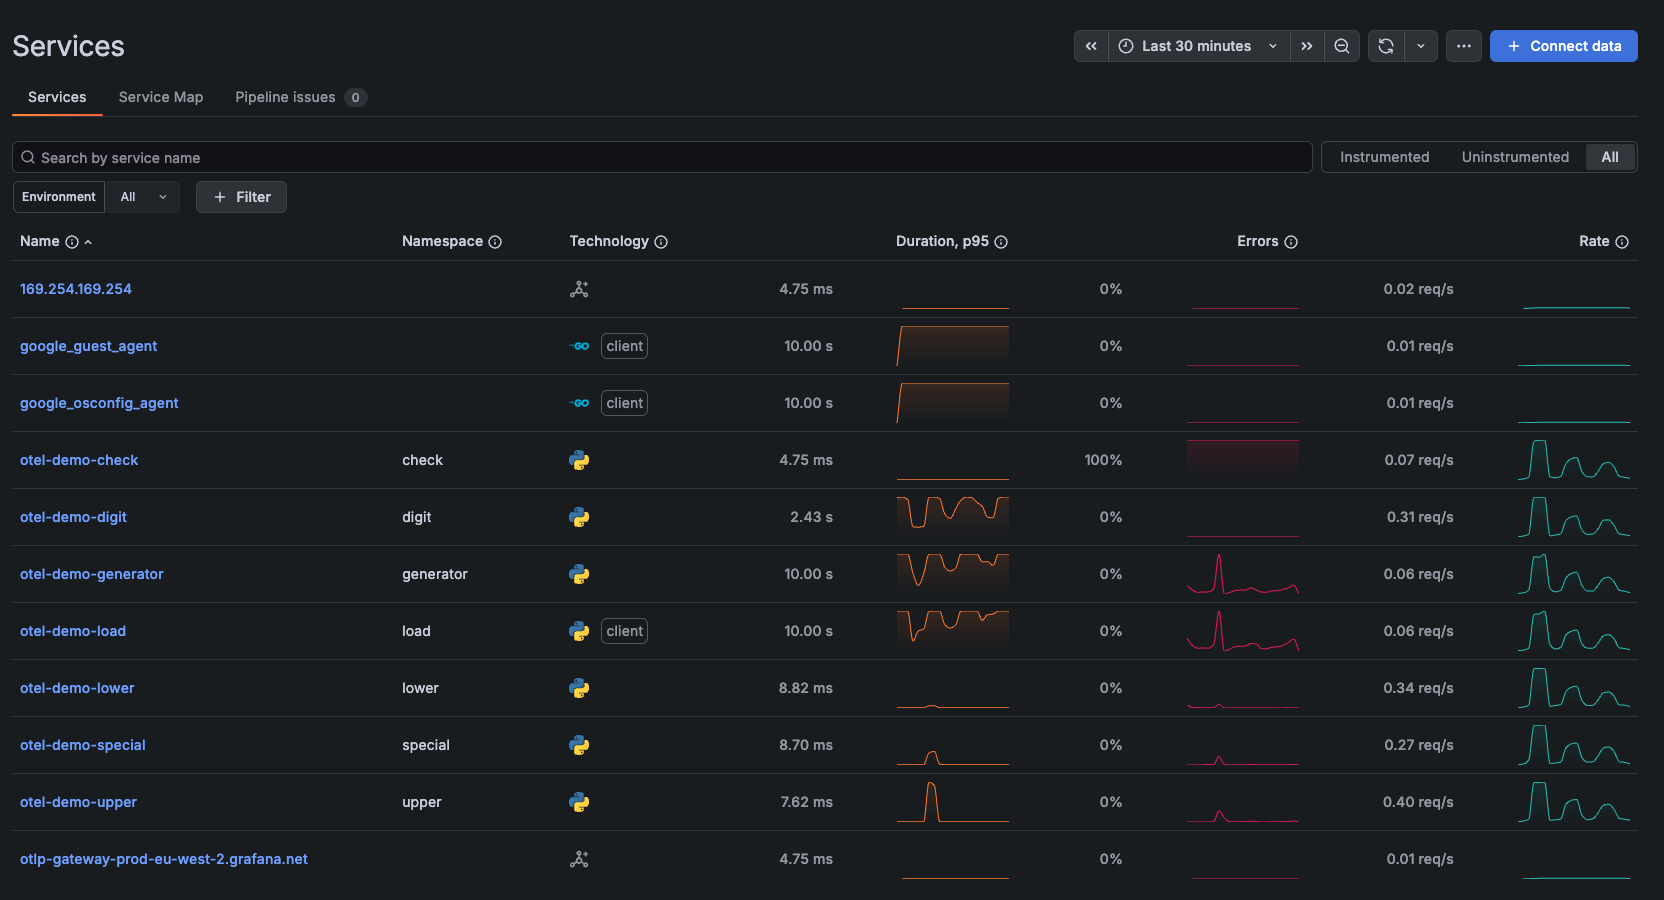
Alloy with Beyla eBPF is a great way to gather the RED metrics from all our services across all VM's.
opensight.ch - roman huesler
Grafana uses the traces_spanmetrics_calls_total metric to display the name, rate, and error rate columns, and traces_spanmetrics_latency_bucket to display the duration column. These metrics must exist in the Prometheus data source and were gathered by our alloy.
Even though I have enabled ebpf.context_propagation, it was not able to create end to and tracing with context propagation but rather created single spans.
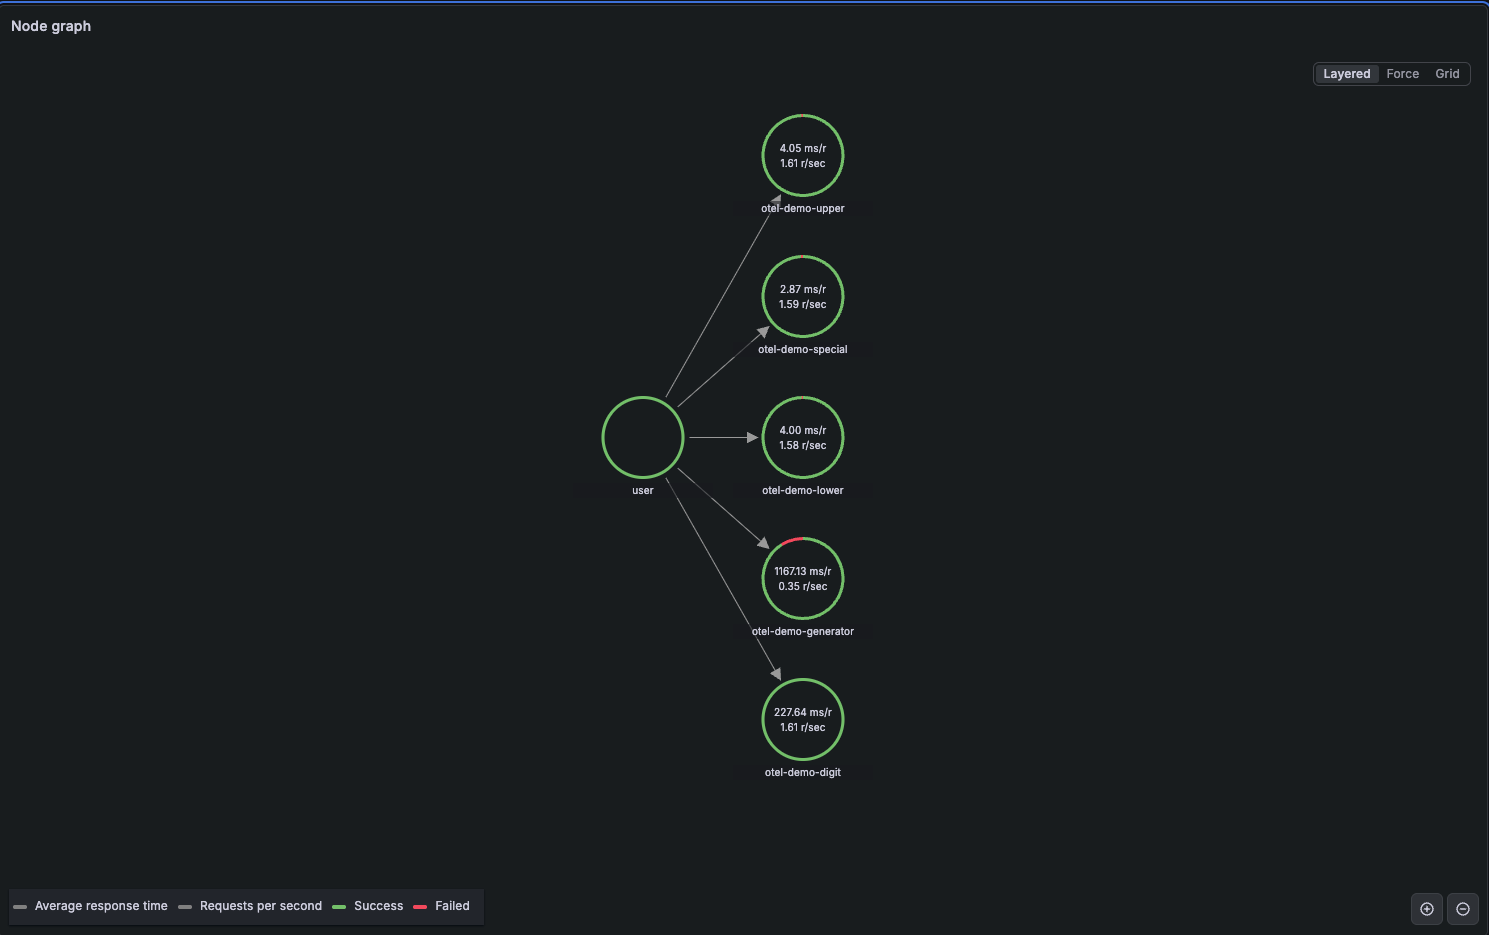
So all in all as per today I find that alloy with beyla eBPF is a great way to gather application RED metrics broadly on all our virtual machines. But not a great way yet to gather distributed traces and generate service maps.
OpenTelemetry Zero Code Auto Instrumentation
Next, I have removed alloy and tried to instrument the whole deployment with OpenTelemetry Zero Code instrumentation. According to OpenTelemetry Documentation this not only works with Python but also .NET, PHP, Java and Javascript.
Let's see how that goes.
I've installed the necessary dependencies for python instrumentation and most importantly the OpenTelemetry SDK.
sudo pip3 install opentelemetry-distro opentelemetry-exporter-otlp
opentelemetry-bootstrap -a install
For every service I have modified the systemd unit file
[Unit]
Description=OpenTelemetry Demo - load Service
After=network.target

[Service]
WorkingDirectory=/home/romanhuesler/opentelemetry-demo/uninstrumented/load
ExecStart=/usr/local/bin/opentelemetry-instrument /usr/bin/python3 load.py
Restart=always
RestartSec=3
Environment=PYTHONUNBUFFERED=1
Environment=OTEL_EXPORTER_OTLP_ENDPOINT=https://my_grafana_otlp
Environment=OTEL_EXPORTER_OTLP_PROTOCOL=http/protobuf
Environment=OTEL_EXPORTER_OTLP_HEADERS="*******"
Environment=OTEL_RESOURCE_ATTRIBUTES=service.name=otel-demo-load,service.namespace=load
Environment=OTEL_TRACES_SAMPLER=always_on
Environment=OTEL_METRICS_EXPORTER=otlp
Environment=OTEL_LOGS_EXPORTER=otlp

[Install]
WantedBy=default.target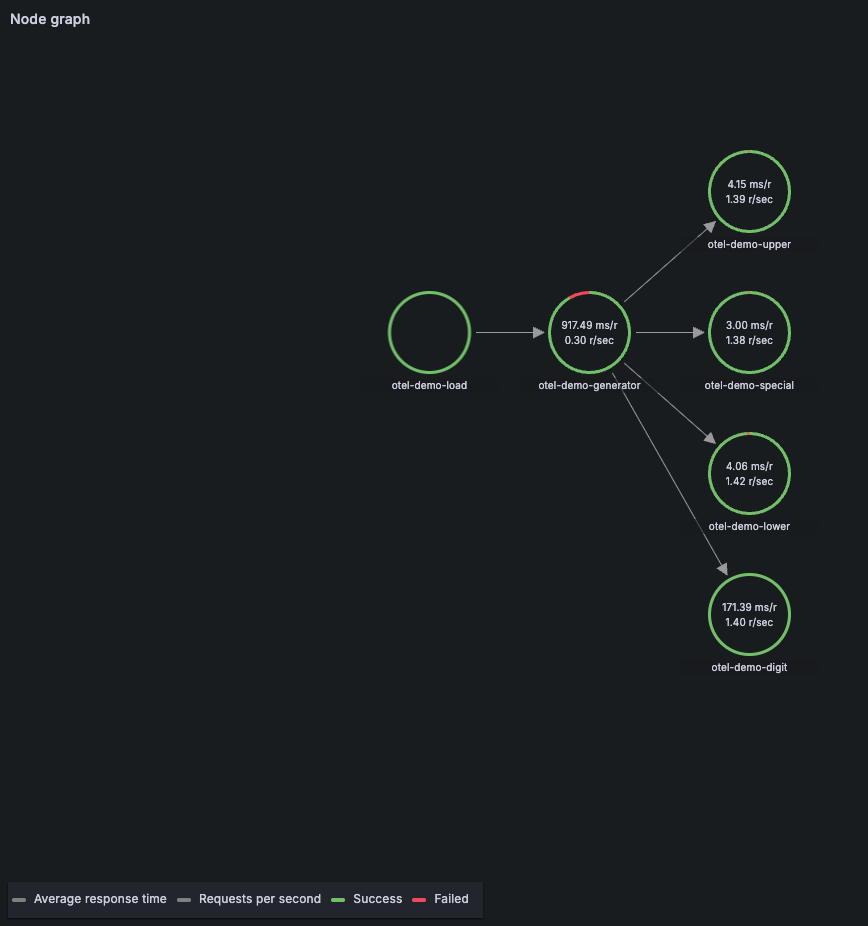
Now we seem to have proper distributed tracing and context propagation. The service map resembles reality. That is what we want - but i wish it would work even simpler so we don't have to change systemd unit files and set environment variables.
OpenTelemetry Injector
The injector is a donation from Splunk to the OpenTelemetry community: a host-based mechanism to automatically inject OpenTelemetry Automatic Instrumentation into your app on any Linux host. It can configure a /etc/preload.so hook that scans process invocations, intercepts them, and adds environment variables for OpenTelemetry.
The Injector does not support python so I have added to the microservices two of my own additional microservices based on NodeJS.
wget https://github.com/open-telemetry/opentelemetry-injector/releases/download/v0.0.2-20251216/opentelemetry-injector_0.0.2-20251216_amd64.deb
dpkg -i opentelemetry-injector_0.0.2-20251216_amd64.deb
From releases page I downloaded and installed the deb package.
On first attempt, I followed the installation guide and broke the virtual machine completely. It was no longer usable. On second attempt, I was not able to get it up and running. That thing would be a nightmare to troubleshoot in production. So at this point, no thanks. But I have to mention it is only v0.0.2 so pre-release. We shall give it time.
Key Take Aways
- Grafana Alloy with Beyla (eBPF-based) delivers excellent RED metrics (Rate, Errors, Duration) almost instantly and with minimal overhead. However, in my single-VM Python Flask demo, distributed tracing wasn't as rich as hoped—context propagation did not work, and I ended up with mostly isolated single spans rather than fully correlated end-to-end traces. By late 2025 (Beyla 2.0+), language-agnostic distributed tracing support has improved significantly for HTTP services, but it still shines brightest in multi-node or Kubernetes environments where Beyla/Alloy runs on all involved hosts.
- OpenTelemetry Zero Code Auto Instrumentation gets us everything desired. However, it's not truly uniform zero-touch across VMs—you typically need to apply runtime-specific attachments or per-process configurations, rather than a single universal agent that magically discovers and instruments everything.
- OpenTelemetry Injector is a pre-release and not quite there yet as far as I am concerned - it cannot be used in production.
How does dynatrace do its magic tracing auto-instrumentation? It uses proprietary, highly optimized single agent per host (OneAgent) that combines deep code-level injection, process monitoring, and network analysis. Overall, while no open-source option yet matches Dynatrace's effortless "install once and done" experience for heterogeneous VM fleets, the combination of OpenTelemetry Injector and language auto-instrumentation agents (or Beyla for eBPF-focused setups) could soon get us there.
Take a look at Grafana Tempo Community Call, where I was asking some questions about OpenTelemetry Instrumentation and Alloy eBPF instrumentation.